top of page
figure showing the relationships among social, ecological, and evolutionary dynamics.

Figures from
Des Roches et al. 2020.
Socio-Eco-Evolutionary Dynamics in Cities. Evolutionary Applications.

Capstone_fig1_Mosquitos_casestudy_final.
Capstone_fig3_Clover_casestudy_final2.jp
Figure showing the relationship among humans, rats, and disease in the city.
Capstone_fig3_Daphnia_casestudy_final.jp
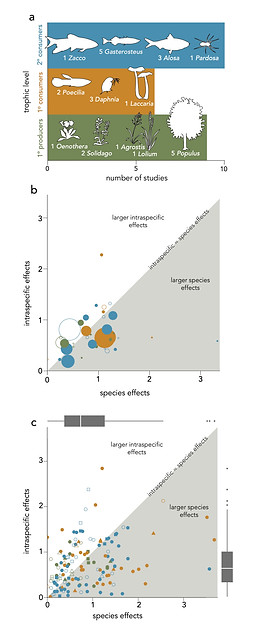
Figure1_concept_comparison_DesRoches2017
Figure2_ForestPlot_REModel_DesRoches2017

Figures from
Des Roches et al. 2018.
The Ecological Importance of Intraspecific Variation.
Nature Ecology & Evolution

Figure showing how systemic racism & classism structure physical & biological environments in cities
Figure showing how biological dynamics differ between high & low income neighbourhoods

Figures from
Schell et al. 2020.
The Ecological and Evolutionary Consequences of Systemic Racism in Urban Environments.
Science.

Figure showing relationships between sexual traits and preference with illustration of a bird

Re-illustration of Steven Arnold's Sexual Selection from
Sinervo. In Press.
Chapter 10: Mate Choice.
Behavioral Genetics to Evolution.

stickleback climate change evolution global change biology
FIG_1_history_latitude_all_habitat_GCB.j

Graphical abstract and figure from

Des Roches et al. 2020.

Climate-Driven Habitat Change Causes Evolution in Threespine Stickleback.

Global Change Biology

Illustration of different experimental ways of studying urban adaptation.
Figure showing different ways that urban trait divergence can occur with lizards as an example
Figure showing plastic and evolutionary mechanisms underlying urban trait change.

Figures from
Lambert et al. 2021
Adaptive Evolution in Cities: Progress and Misconceptions
Trends in Ecology & Evolution

scientific figures

Figure showing examples of how variation within species can lead to nature's contributions to people
Graph showing relationship between contemporary and historical genetic heterozygosity

Figures from
Des Roches et al. 2021
Conserving Intraspecific Variation for Nature's Contributions to People
Nature Ecology & Evolution

Figure showing how restoration, preservation, management can prioritize intraspecific variation
ISEECI_Fig_4_casestudies_v4_nonNRS_water
ISEECI_Fig_3_casestudies_v4_watercolour.

Figures from
Stuble et al. 2021.
Regional Networks of Biological Field Stations to Study Climate Change
BioScience

My love for art, ecology, and communication come together when I create my scientific figures. Please contact me if I can help you with your own!

VNC_zonation_final_text.jpg
VNC_armoured_final.jpg
VNC_restored_final.jpg

Figures from
Vashon Nature Center Exhibit 2021
Puget Sound Shoreline: Zonation (left); Unrestored armored(top right); Restored unarmored (bottom right)

Fig_1_mfish_v2.jpg

Figures from
Des Roches & Robinson et al. 2022
The legacy of predator threat shapes prey foraging behaviour
Oecologia

Figure_3_Mosquitofish_ME_preysize_v2.jpg
Figure_2_Mosquitofish_QPME_v2.jpg
bottom of page